

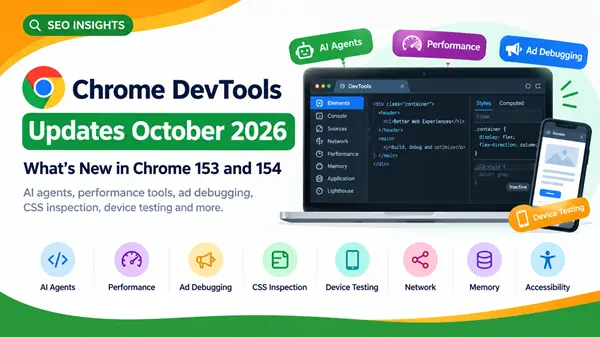
Chrome DevTools Updates October 2026: What’s New in Chrome 153 and 154
Chrome DevTools is no longer just a place to inspect HTML, change CSS, or look at JavaScript errors.
For developers, SEO professionals, website owners, and teams using AI coding tools, DevTools is becoming a much broader workspace for understanding how a website behaves.
The latest Chrome DevTools updates for October 2026 bring improvements across performance testing, AI-assisted development, advertising diagnostics, CSS inspection, device emulation, network debugging, memory analysis, and accessibility.
The update covers features that arrived in Chrome 153 and Chrome 154 and were summarized by the Chrome DevTools team on September 22, 2026.
Here is what website developers and SEO beginners should know.
What’s New in Chrome DevTools in October 2026?
The October 2026 DevTools update focuses on several practical areas:
- More control for AI coding agents using Chrome DevTools MCP.
- New tools for examining advertising scripts and ad-related resource usage.
- End-to-end support for measuring soft navigations.
- More reproducible CPU performance testing.
- Better CSS inspection through inactive style rules.
- Updated device presets for responsive testing.
- Easier network request editing and resending.
- More detailed JavaScript memory analysis.
- Improved keyboard and screen-reader accessibility.
These are not all equally important for every website owner. The value depends on whether you are debugging performance, CSS, advertising, JavaScript memory, responsive layouts, or AI-assisted development.
-
Chrome DevTools Gets More Controls for AI Coding Agents
One of the most noticeable directions in the latest Chrome DevTools updates is the growing connection between DevTools and AI coding agents.
The Chrome DevTools MCP server now includes additional controls for agents that inspect and debug websites.
For example, developers can configure JavaScript execution controls so that an agent can inspect a page without evaluating JavaScript. The setting can continue across navigations and initialization scripts.
This matters because an AI coding agent needs access to useful browser information, but developers also need control over what the agent is allowed to execute.
Source maps can also be loaded on demand
Large JavaScript applications can contain substantial source-map data.
The updated DevTools MCP tooling allows source maps to be disabled or loaded when required. According to Chrome’s documentation, this can help avoid excessive memory use on large sites.
The update also adds:
- Configurable file-system roots.
- CLI path permissions.
- Heap snapshot inspection.
- PWA automation tools.
- Optional console stack traces.
- Support for the Agent Plugins 1.0 package.
For developers experimenting with AI coding workflows, this makes browser debugging more granular.
-
New Ad Debugging Tools Help Explain Advertising Costs
If your website displays advertising, the new Ads area in the Application panel deserves attention.
Chrome has introduced a centralized place for investigating page-wide advertising information following the introduction of four experimental ad metrics in the Chrome User Experience Report.
The DevTools interface can show:
- Viewport ad density.
- Viewport ad count.
- Total CPU usage by ads.
- Total network usage by ads.
- CPU and network usage associated with ad elements.
- Advertising scripts running in the main frame.
- A way to highlight ads on the page.
This is particularly interesting for publishers.
Imagine a content website where the page feels sluggish after several advertising scripts load. Instead of simply guessing that “ads are slowing the page,” a developer can inspect advertising-related activity and investigate which elements and scripts are consuming resources.
What this means for SEO
This is not a new ranking guarantee or an automatic SEO improvement.
Instead, it gives website teams another debugging tool for understanding resource usage.
For an ad-supported site, a sensible workflow is:
- Test the page without making assumptions about the cause.
- Examine advertising-related activity.
- Check CPU and network usage.
- Compare the findings with broader performance measurements.
- Optimize only where the evidence indicates a problem.
The experimental nature of the referenced CrUX ad metrics should also be kept in mind.
-
Performance Panel Adds Full Soft Navigation Support
Modern websites do not always perform a traditional full-page reload when users move between pages.
Single-page applications can change the visible content while keeping the same document loaded. These transitions are commonly referred to as soft navigations.
Chrome previously introduced soft-navigation support in Live Metrics and trace views. The October update extends this analysis into Performance panel Insights, completing the end-to-end workflow described by Chrome.
Why should SEO professionals care?
Performance analysis becomes more complicated when a website behaves like an application.
A user may click a link and see new content without a conventional browser navigation. If you only think about traditional page loads, you can miss important parts of the user experience.
For SEO and performance work, this means developers can investigate how these transitions behave instead of treating every interaction as a conventional reload.
-
CPU Performance Testing Becomes More Reproducible
Different computers produce different performance results.
A powerful desktop and an older mobile device can execute the same JavaScript at very different speeds.
Chrome DevTools now supports calibrated CPU performance tier overrides through the Chrome DevTools Protocol using Emulation.setCPUPerformanceOverride. This allows developers to configure and dispatch CPU performance settings designed to make testing across hardware tiers more reproducible.
A simple example
Suppose a developer fixes a JavaScript problem and wants to compare performance before and after the change.
Instead of relying entirely on the speed of the computer being used for testing, the developer can use controlled CPU settings and repeat the test.
That makes performance investigations easier to reproduce.
Remember that controlled laboratory testing is different from real-user performance data. It should be used as part of a broader measurement process rather than treated as a replacement for field data.
-
Performance Flame Charts Become Easier to Search
The Performance panel also improves trace investigation.
Pressing Ctrl+F in the flame chart can now match entries in custom tracks registered through the Extensibility API. The search can examine tooltip text, properties, and user details.
For developers dealing with complex traces, this can save time.
Instead of visually scanning a large timeline, you can search for relevant information.
Chrome has also improved visualization of threads containing only CPU profile samples. This can make background execution, including WebAssembly-related threads, more visible in timeline views.
-
DevTools Can Now Show Inactive CSS Styles
CSS debugging often creates a familiar situation.
You select an element, see several CSS rules, change one property, and suddenly another rule stops applying.
Previously, understanding what had changed could require more investigation.
The updated Elements panel can continue displaying style rules that previously matched the selected element even after those rules stop applying. DevTools visually identifies them as inactive styles.
This can be useful when troubleshooting:
- CSS specificity.
- Responsive styles.
- State changes.
- Component styling.
- CSS overrides.
- Dynamic interfaces.
Why this is useful for beginners
You do not need to understand every CSS rule immediately.
An inactive style can provide a clue about what used to apply and why the current appearance is different.
That makes the Elements panel more useful as a learning tool as well as a professional debugging tool.
-
Keyboard Accessibility Gets Better in Elements
The Elements panel has also received accessibility improvements.
Interactive adorners in the DOM tree, including View Source, Starting Style, Scroll Snap, and Reveal, are now keyboard focusable and can be activated with Enter or Space.
Chrome also improved DOM-node drag-and-drop behavior across shadow DOM boundaries and reduced unnecessary visual flashing when CSS property checkboxes are toggled.
These may look like small interface changes, but they matter when DevTools itself needs to be accessible and predictable.
-
Device Mode Gets a More Modern Device Catalog
Responsive testing is another area receiving a noticeable refresh.
Chrome DevTools now groups emulated devices by form factor:
- Mobile
- Foldables
- Tablets & Desktops
- Smart Displays
The device catalog has also been updated with newer presets, including devices such as the iPhone 16, Pixel 9, Pixel 10, Galaxy Z Fold 6, iPad Pro 13-inch, and Nest Hub Max. Some older device definitions have been retired.
A useful workflow for website owners
If you manage a website, do not test only the desktop version.
Open DevTools and use Device Mode to examine:
- Navigation menus.
- Headings.
- Images.
- Buttons.
- Forms.
- Advertisements.
- Tables.
- Horizontal scrolling.
- Content spacing.
- Core page interactions.
A page can look excellent on a desktop monitor while creating usability problems on a smaller screen.
Device emulation does not replace testing on real hardware, but it is a useful first step.
-
Network Panel Makes Fetch Testing Easier
The Network panel is one of the most useful parts of Chrome DevTools when diagnosing website problems.
The latest update simplifies the process of modifying a request and testing it again.
When you choose Edit and resend as fetch, DevTools now focuses the Console and places the corresponding fetch() expression into the prompt. The expression includes parameter comments and a reference to the original request.
Why this matters
Suppose an API request returns an unexpected response.
You can inspect the original request, edit the relevant parameters, and resend it as a fetch() request.
That creates a practical bridge between:
Network inspection → JavaScript testing → troubleshooting
This is especially useful for developers working with APIs and dynamic websites.
-
Local Overrides Receive Security Hardening
Chrome has also tightened security around local overrides.
The Network panel now prevents path traversal using %2E%2E and prevents overrides from being created for schemes such as:
- data:
- blob:
- javascript:
- about:
The goal is to make the local override workflow safer while retaining its usefulness for development.
Chrome also improved Windows cmd.exe compatibility when copying network requests as cURL commands by escaping certain characters appropriately.
-
Memory Panel Gets Better Heap Snapshot Analysis
JavaScript memory problems can be difficult to understand because a page may continue holding objects that developers no longer expect to exist.
The updated Memory panel gives developers more ways to investigate heap snapshots.
Developers can now:
- Filter edges by minimum retained size.
- Exclude primitive values from certain views.
- Sort edges by retained size, self size, or name.
- Query heap snapshot objects by retained-size threshold.
- Query objects by property name.
- Analyze memory retained by V8 execution contexts.
Chrome has also improved error handling for invalid or corrupted heap snapshots so that these files produce clearer errors rather than causing parsing to hang.
Why memory matters to website performance
A page that continuously accumulates unnecessary objects can become increasingly difficult to manage.
For a complex web application, memory analysis can therefore complement the normal performance workflow.
It is particularly relevant to developers investigating:
- Memory leaks.
- Long-running web applications.
- Large JavaScript applications.
- WebAssembly workloads.
- Objects that remain referenced unexpectedly.
-
Accessibility Improvements Continue Across DevTools
Accessibility is another part of the October 2026 update.
Chrome 153 and Chrome 154 include improvements such as better VoiceOver announcements for expanded and collapsed DOM tree states on macOS.
The Issues counter also received changes intended to avoid duplicate screen-reader announcements.
Chrome additionally added an AccessibilityAnnouncementRecordingView for recording and debugging live announcements and ariaNotify calls.
For developers, this reinforces an important principle: accessibility testing is not something to leave until the end of a project.
It should be part of normal development and debugging.
What These DevTools Updates Mean for SEO Beginners
You do not need to become a JavaScript engineer to benefit from Chrome DevTools.
For an SEO beginner, focus on a few practical areas.
Check mobile presentation
Use Device Mode to see how your pages behave at different viewport sizes.
Look for:
- Text that becomes difficult to read.
- Buttons that are difficult to tap.
- Images that overflow.
- Navigation problems.
- Unexpected horizontal scrolling.
Investigate performance problems
Use the Performance panel when a page feels slow.
Look for expensive JavaScript, long-running tasks, rendering activity, and navigation behaviour.
Examine advertising impact
If your site runs advertisements, investigate the new Ads area when performance appears to be affected by advertising resources.
Inspect CSS problems
When an element looks wrong, open Elements and inspect its active and inactive CSS rules.
This can be much faster than guessing which stylesheet contains the problem.
Check network requests
If content or an API-powered component is not working, use the Network panel.
Look at:
- Request URL.
- Status code.
- Response.
- Request payload.
- Timing.
- Headers.
The new Edit and resend as fetch workflow can make experimentation easier.
A Simple Chrome DevTools Workflow for Website Owners
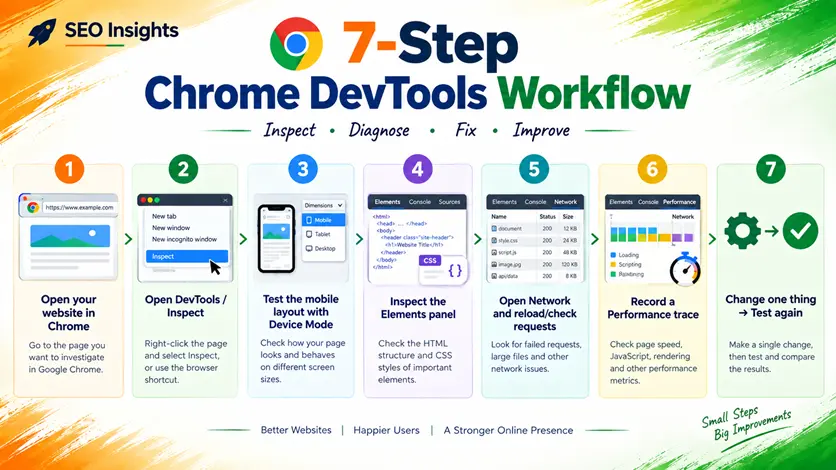
If you are new to DevTools, do not try to learn every panel at once.
Start with this workflow.
Step 1: Open your website
In Chrome, open the page you want to investigate.
Step 2: Open DevTools
Right-click the page and choose Inspect, or use the browser’s developer-tools shortcut.
Step 3: Test the mobile layout
Open Device Mode and select an appropriate mobile preset.
Check the page visually.
Step 4: Inspect the Elements panel
Select important elements such as:
- H1.
- Navigation.
- Images.
- Buttons.
- Main content.
- Footer.
Look at the HTML and CSS.
Step 5: Open Network
Reload the page and examine important requests.
Look for failed requests or unusually large resources.
Step 6: Record a Performance trace
If the page feels slow, use the Performance panel to record a trace and investigate where time is being spent.
Step 7: Make one change at a time
Do not make ten changes simultaneously.
Change one issue, test again, and compare the result.
This creates a much clearer debugging process.
Does Chrome DevTools Affect Google Rankings?
Chrome DevTools itself is not a Google ranking factor.
It is a development and debugging environment.
However, developers can use DevTools to investigate technical issues that may affect user experience, such as slow JavaScript execution, rendering problems, responsive-layout issues, network failures, and other technical problems.
That distinction is important.
Using a DevTools feature does not automatically improve search visibility. The benefit comes from identifying and fixing genuine problems on the website.
Chrome’s DevTools documentation describes the platform as a set of browser-based tools for editing pages and diagnosing problems, with dedicated capabilities for performance, network activity, resources, accessibility, and more.
Chrome DevTools and the Future of AI-Assisted Development
The October update also shows how browser debugging is changing.
Chrome DevTools for agents provides coding agents with access to browser-level capabilities such as inspecting network activity, recording traces, and troubleshooting web applications. Chrome’s documentation describes the MCP integration as a way to connect DevTools capabilities to coding-agent workflows.
The important point is not simply that AI can inspect a website.
The bigger change is the connection between:
AI agent → browser → DevTools → evidence → debugging
An agent can work with information from the actual running web application rather than relying only on source code.
That makes browser-based verification an increasingly important part of AI-assisted development.
How to Get the Most From the October 2026 DevTools Update
If you are a beginner, start small.
For SEO: inspect mobile layouts, network requests, performance traces, and important page elements.
For developers: explore Performance, Network, Elements, Memory, and the DevTools MCP capabilities.
For publishers: investigate advertising-related CPU and network activity when diagnosing performance.
For JavaScript developers: explore heap snapshots, CPU profiles, soft navigation analysis, and network request testing.
For accessibility-focused teams: use the improved keyboard and screen-reader-related DevTools capabilities as part of your testing workflow.
The best workflow is evidence-driven: reproduce the problem, inspect it, make a targeted change, and test again.
Key Takeaways
- Chrome DevTools updates October 2026 cover Chrome 153 and Chrome 154.
- DevTools for agents gains more JavaScript execution, source-map, memory, PWA, and security controls.
- The Application panel adds tools for investigating advertising scripts and experimental ad metrics.
- The Performance panel now provides end-to-end soft-navigation analysis and calibrated CPU performance overrides.
- Elements improve CSS debugging with inactive styles and better keyboard accessibility.
- Device Mode receives updated device presets and clearer form-factor categories.
- Network and Memory panels gain more detailed debugging capabilities.
- Accessibility improvements make DevTools itself easier to use with assistive technologies.
Frequently Asked Questions
-
What is new in Chrome DevTools in October 2026?
The October 2026 update includes improvements to DevTools for agents, advertising diagnostics, Performance, Elements, Device Mode, Network, Memory, and accessibility. The recap covers features that landed in Chrome 153 and Chrome 154.
-
What is Chrome DevTools MCP?
Chrome DevTools MCP is an integration that gives compatible coding agents access to DevTools capabilities for inspecting and debugging web applications. The October update adds additional controls for JavaScript execution, source maps, memory inspection, PWA automation, and other workflows.
-
Can Chrome DevTools help with SEO?
Yes. DevTools can help SEO professionals investigate technical aspects of websites, including mobile layouts, network behavior, page performance, HTML, CSS, JavaScript, and accessibility. It is a diagnostic tool rather than a direct ranking tool.
-
What are soft navigations in Chrome DevTools?
Soft navigations are page transitions where a website can update its visible content without performing a traditional full-page browser navigation. The October 2026 Performance update extends soft-navigation analysis into Performance panel Insights.
-
What is the new Ads feature in Chrome DevTools?
The Application panel includes an Ads area that brings together advertising-related information, including experimental ad metrics, ad scripts in the main frame, CPU and network usage by ad elements, and an option to highlight ads.
Conclusion
The latest Chrome DevTools update is broader than a collection of small interface changes.
It reflects how modern websites are becoming more dynamic, application-like, performance-sensitive, and increasingly connected to AI development tools.
For beginners, the most useful lesson is simple: use DevTools to replace guesswork with evidence.
When a page is slow, inspect its performance. When a layout looks wrong, inspect the DOM and CSS. When an API fails, examine the network request. When a web application consumes too much memory, investigate its heap. When advertising appears to affect performance, examine the available ad diagnostics.
You do not need to master every DevTools panel on day one.
Start with one problem, inspect the evidence, make one change, and test again.
That approach makes Chrome DevTools much less intimidating—and much more useful for everyday website development and SEO troubleshooting.